Observability and Tracing
Overview
The platform implements distributed tracing and dynamic log-level control through HTTP headers that propagate across incoming requests and downstream service calls. This enables comprehensive monitoring, debugging, and request correlation across microservices.
Core Headers
| Header | Purpose | Scope | Notes |
|---|---|---|---|
X-Trace-Id | Distributed trace identifier for end-to-end request tracking | Returned on every response; downstream calls carry the trace in the standard traceparent header | Auto-generated if absent |
X-Correlation-Id | Correlates all events from a single user session | Propagated through HTTP service calls | Assigned by client (UI) |
X-Request-Id | Unique identifier for a single HTTP request | Propagated through HTTP service calls | Fallback: random UUID if absent |
X-Debug-Level | Temporarily override the effective log level for the request | Applies to cz.datalite loggers and to the tsm.ui frontend logger for the entire request lifecycle and downstream HTTP calls | Values: TRACE, DEBUG, INFO, WARN, ERROR |
None of these headers crosses a Kafka topic — see Message queues.
X-Trace-Id
A unique trace ID is generated for every incoming request that does not already carry one, and every response returns it in the X-Trace-Id header. In the logs it appears under the traceId field.
Downstream services are not given an X-Trace-Id request header. They receive the trace through the W3C traceparent header, which the tracing instrumentation adds to outgoing HTTP calls automatically, so log entries on both sides of a call share the same traceId.
Use case: Correlating log entries across multiple microservices to understand the full journey of a request. Take the X-Trace-Id value from the response and search the logs for that traceId.
X-Correlation-Id
Allows correlating all log entries that belong to a single user session across multiple services. This is typically set once at the UI level and remains constant for the entire user session, even across multiple requests.
Use case: Grouping all activity from a single user session, even if the session spans multiple HTTP requests and several services.
X-Request-Id
Identifies a single HTTP request uniquely. Unlike the trace ID (which may span multiple requests), the request ID changes with each HTTP call.
Note: Request IDs propagate through service-to-service HTTP calls.
X-Debug-Level
Temporarily raises the effective log level for the entire request lifecycle without modifying persistent configuration. This is useful for investigating issues in production by enabling DEBUG or TRACE logs on demand.
Valid values (case-insensitive): TRACE, DEBUG, INFO, WARN, ERROR
Scope: Single request only—the override does not persist beyond the current request thread. Only loggers under the cz.datalite package are affected, plus the tsm.ui logger that carries the frontend records described below; third-party and framework loggers remain at their configured levels.
Setting it from the UI: the backendLogLevel user parameter (user detail → User parameters) makes the web client attach this header to every API call it sends. There is no switch and no expiry—clear the parameter when the investigation is over.
Downstream: the header is forwarded to downstream HTTP calls as tracing baggage, so the raised level applies to the whole call chain of the request.
Message queues
Trace context does not cross a Kafka topic. Spring Kafka observability
(spring.kafka.template.observation-enabled, spring.kafka.listener.observation-enabled) is left at
its default false, so a consumer starts its own trace instead of continuing the producer's one, and
no baggage rides along either. A message handler therefore logs a different traceId than the request
that produced the message.
To follow processing across a topic, put a business identifier into the message, log it on both sides, and search on that — for example the entity id or the correlation id. Some modules already do exactly that, so a consumer's log lines may carry a correlation id even though the platform did not propagate it — the value came from the message body, not from a header.
Frontend Logging to Kibana
The web client sends its own log records to Kibana over the existing STOMP websocket. The backend writes them under the logger name tsm.ui, so a single Kibana filter (logger_name: "tsm.ui") returns everything the UI produced.
Two kinds of records reach Kibana:
| Record | When | Controlled by |
|---|---|---|
| Uncaught JavaScript errors | Always, for every signed-in user | Nothing to configure |
| HTTP request and response traces | On demand | frontendHttpLog and the Diagnostics switch |
Records reach Kibana only on deployments with the ELK integration enabled (tsm.elk.enabled together with tsm.elk.logstash.url). Elsewhere they are produced but never shipped.
The frontendHttpLog user parameter
Set on user detail → User parameters. It selects the level only; on its own it never starts sending anything.
| Value | Records sent |
|---|---|
| (not set) | Nothing. The Diagnostics switch stays disabled. |
ERROR | Failed requests only—method, URL, status, duration, and the error response body. |
DEBUG | Every request—method, URL, status, duration. |
TRACE | Everything DEBUG sends, plus request and response bodies truncated to 10 000 characters. |
Levels are cumulative, as in any logger. A failed request is always recorded at level ERROR whatever the configured level, so HTTP failures can be filtered together with the rest of the errors.
Which one to pick:
ERRORanswers "something fails for this user and we do not know what". The volume is low, so it can stay on for the whole 24 hours without flooding anything.DEBUGanswers "which calls does this screen actually make, and how long do they take".TRACEanswers "what exactly went over the wire"—reach for it only when metadata is not enough.
Request and response bodies can contain personal data, business content, and anything else the user typed into a form. TRACE copies them into Kibana, where they are kept for as long as the log retention allows. Use it deliberately, on one user at a time, and switch back once the investigation is over. ERROR and DEBUG never send request bodies.
Turning it on
Avatar menu → Diagnostics → HTTP log. The switch requires the Toolbar.HttpLog privilege; without it that one row is hidden. The Diagnostics section itself opens for anyone holding at least one of Toolbar.FluentDebugger (the Debug switch), Toolbar.HttpLog, or Toolbar.Kibana—each row is gated by its own privilege.
HTTP log activation is stored in the browser and expires after 24 hours, after which logging stops by itself. It applies only to the browser where it was switched on—on another device the switch has to be enabled again. The tooltip on the switch shows the exact expiry time.
Separating configuration (the parameter) from activation (the switch) is deliberate: saving the parameter never starts sending data on its own, and an activation that someone forgets about silences itself.
The separate Debug switch enables the Form Runtime Debugger for inspecting a rendered form, its validation, JEXL values, and effect history.
What is never sent
- Request headers, including
Authorization - The token endpoint and the runtime configuration file
- Anything outside the configured API base URL
- Binary payloads such as file uploads and downloads
- Response bodies whose
Content-Lengthis above 256 KB—replaced by a size marker. A response that does not declare the header is serialized and then truncated like any other body - Request bodies at any level other than
TRACE
Reading the records in Kibana
Filter on logger_name: "tsm.ui" and narrow down by level.
| Field | Content |
|---|---|
X-Correlation-Id | Identifies the current application run in the browser. The same value travels in the header of every backend call, which is what pairs UI records with server-side logs. |
message | Human-readable summary, for example HTTP GET /api/tickets -> 500 (1243ms) |
tsm.ui.http.method, tsm.ui.http.url | Method and address of the traced request—not to be confused with tsm.request.uri, which is the page the user was on |
tsm.ui.http.status, tsm.ui.http.duration-ms | Response status and round-trip duration. Both are indexed as numbers, so ranges work—tsm.ui.http.status >= 500 and tsm.ui.http.duration-ms > 2000 finds slow failures. |
tsm.ui.data | The whole payload as the browser sent it, including request and response bodies at TRACE |
tsm.user.id, tsm.request.uri | Signed-in user and the page address in the browser |
tsm.ui.error-type, tsm.ui.component-name, stacktrace | Error detail |
tsm.ui.timestamp, tsm.ui.user-agent | Client-side timestamp and browser |
tsm.<entity>.id, tsm.<entity>.key | Which record the request was about—see Jumping from a record to its logs |
The Kibana button in the same Diagnostics section (privilege Toolbar.Kibana) opens Kibana already filtered on the current X-Correlation-Id.
Logging is fire-and-forget over an already open websocket, so it neither delays requests nor blocks the application.
Jumping from a record to its logs
The correlation id answers "what happened in this browser session". The other question—"what happened to this customer, ticket, order"—is answered by the Kibana button in the detail's overflow menu (⋮). It is available on customer, account, lead, person, ticket, order, catalog category, catalog specification, and entity instance configuration, and needs the same Toolbar.Kibana privilege.
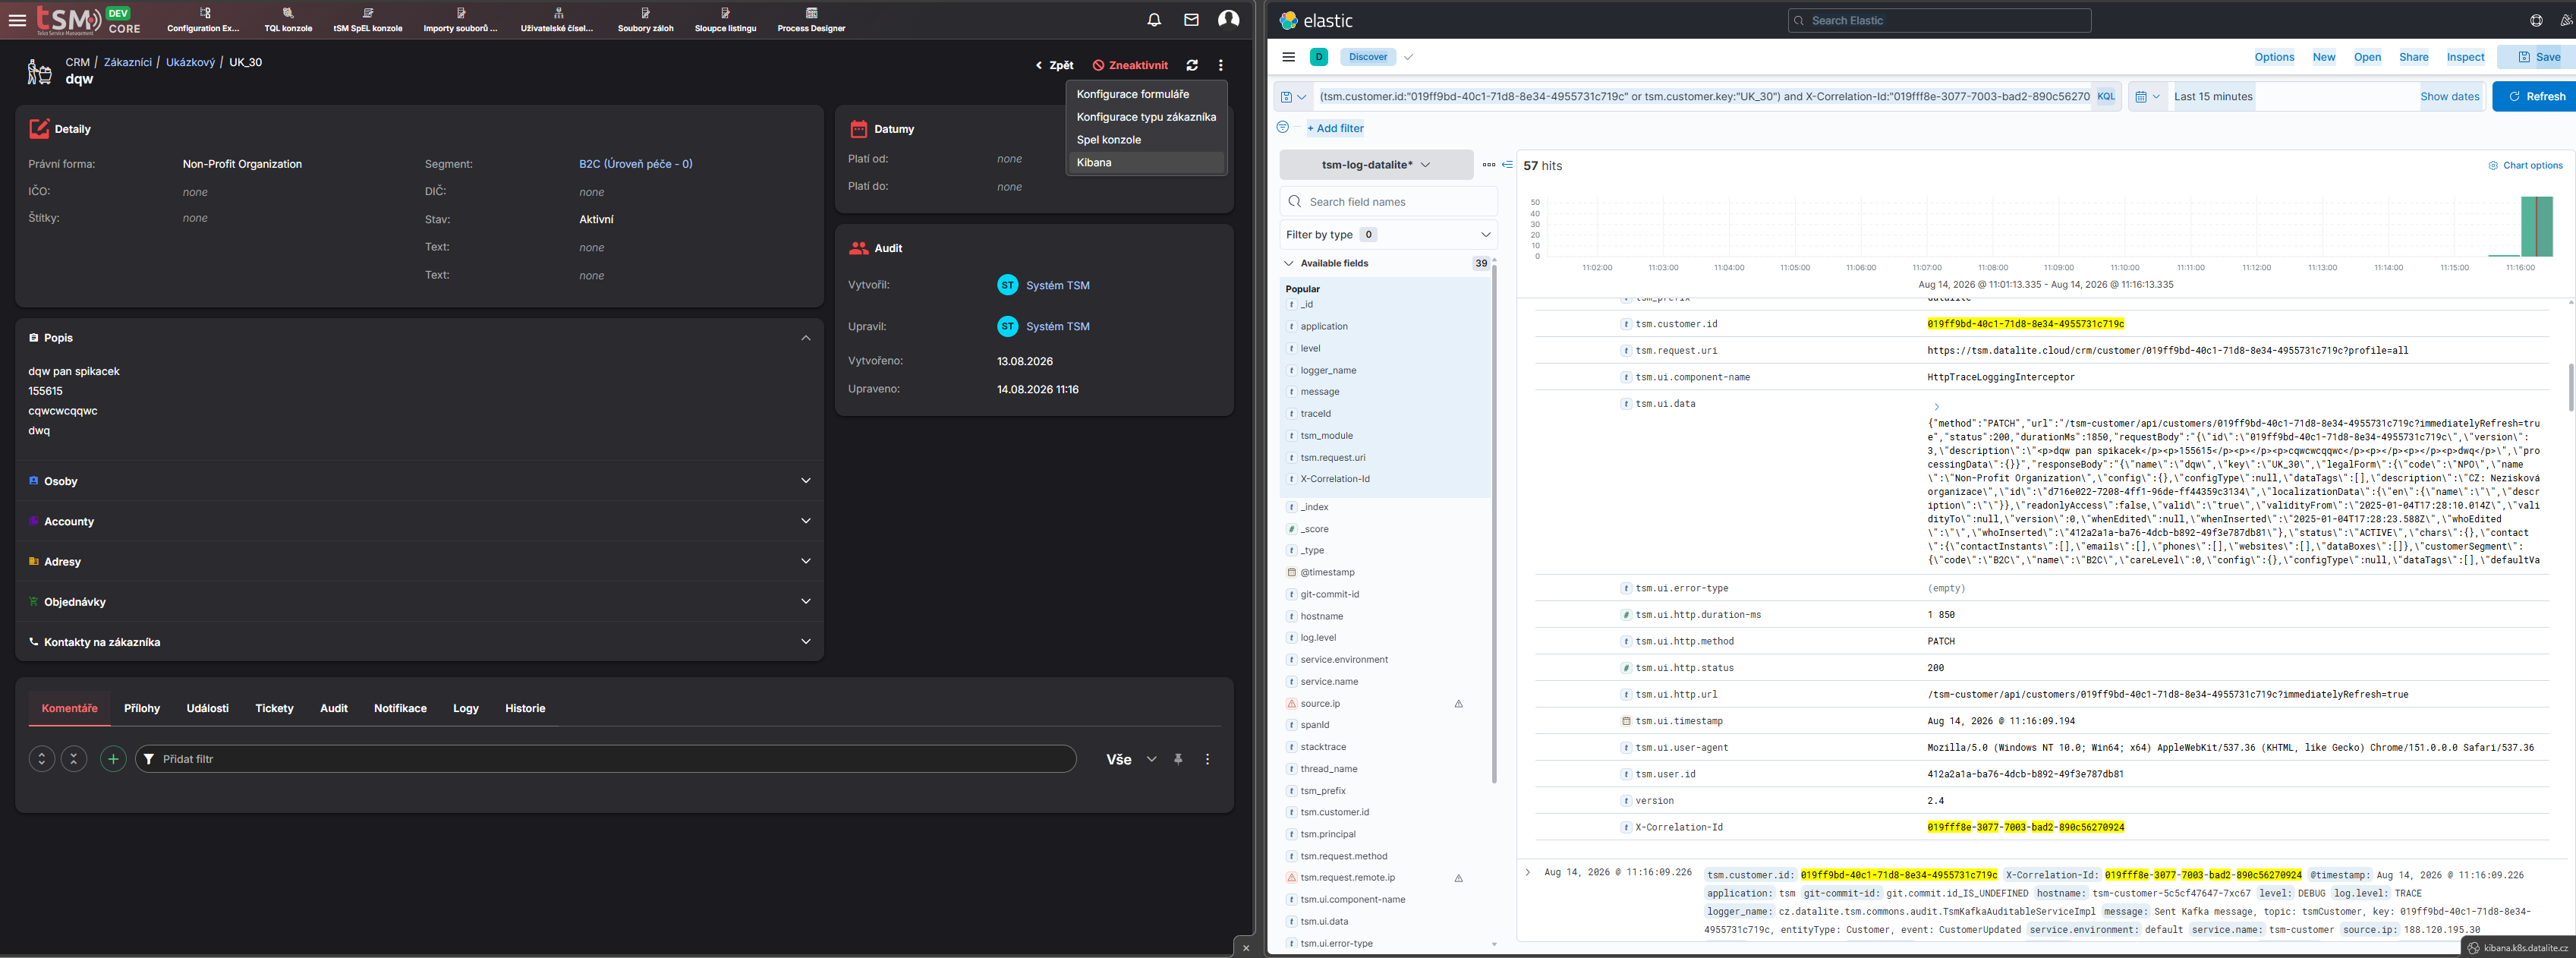
The button opens Kibana with both questions combined:
(tsm.customer.id:"019ff9bd-40c1-71d8-8e34-4955731c719c" or tsm.customer.key:"UK_30") and X-Correlation-Id:"019fff8e-3077-7003-bad2-890c56270924"
Two details are worth knowing, because they explain what the result set contains.
Why two entity fields. The backend derives the field from the request URL: /api/v2/customers/{idOrKey} becomes tsm.customer.*, and the suffix depends on what the URL carried—a UUID is logged as .id, a business code as .key. Since a record can be opened either way, the button searches both and joins them with or. The parentheses matter: KQL binds and more tightly than or, so without them the correlation id would only apply to the second term.
Why the correlation id is still there. It narrows the result to the current browser session. Delete that part of the query to see everything that ever touched the record, from any user and any session—which is what "who broke this record yesterday" needs.
Not every log line about a record carries its entity field. The field comes from the URL of the request being served, so it is missing for record creation (POST with no id in the URL), for listings and searches, and for work that happens outside the request thread—Kafka consumers, Camunda jobs, and calls chained into other microservices. When the entity filter returns too little, fall back to the correlation id alone.
The same rule applies to the UI's own records: an HTTP trace sent over the websocket is matched from the URL it logged, so it reaches Kibana with the same tsm.<entity>.* field as the backend lines about that request.
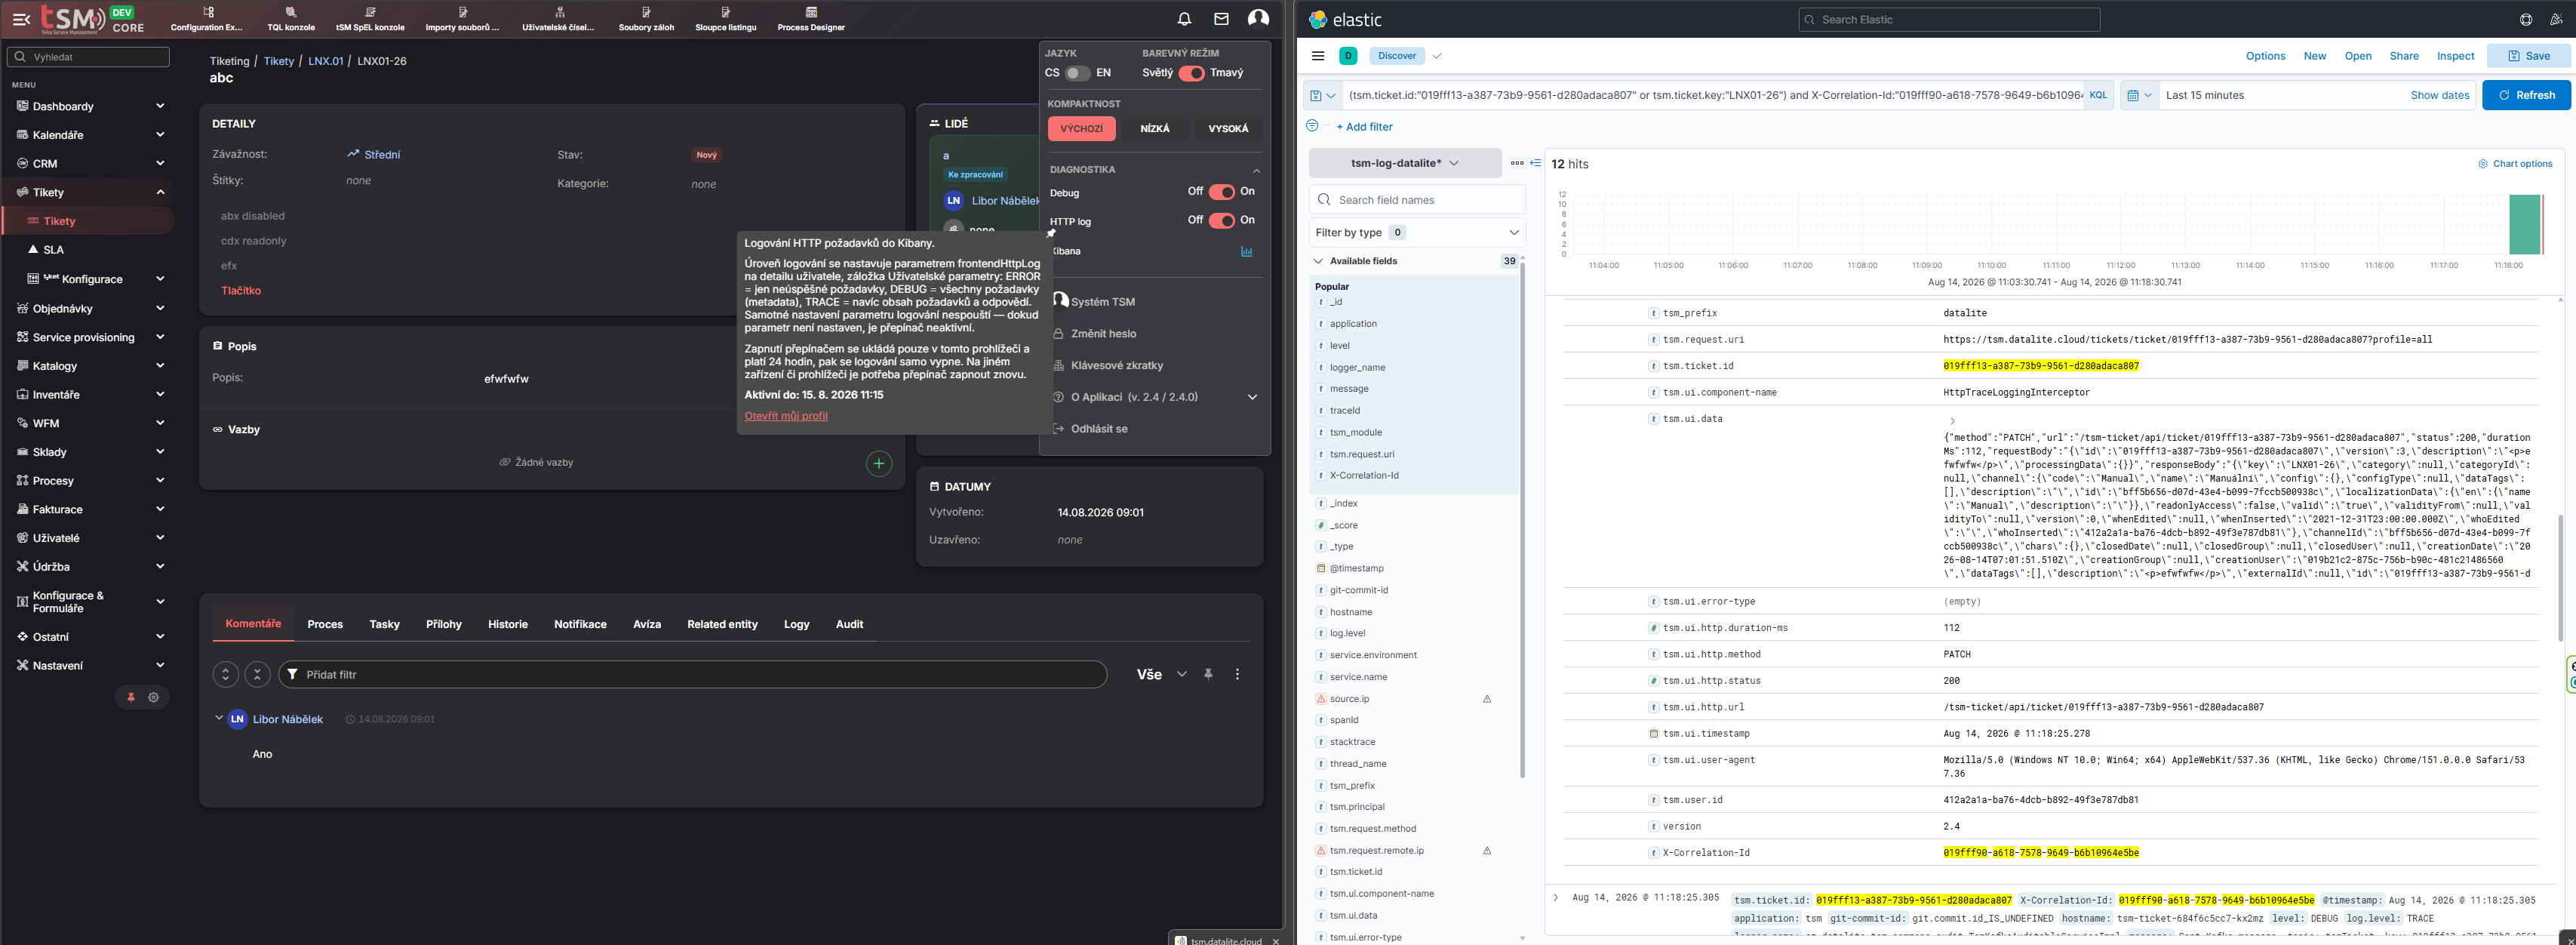
A typical investigation therefore runs:
- Set
frontendHttpLogon the user (DEBUG, orTRACEwhen payloads are needed) and switch HTTP log on in Diagnostics. - Reproduce the problem in the UI.
- Open the affected record and use ⋮ → Kibana. The UI and backend lines for that record and that session are already filtered.
- Delete
X-Correlation-Idfrom the query to see the record's whole history, or delete the entity part to see the whole session.
Forms can carry the same button through the dtl-kibana-button widget—see the widget reference.
Frontend and Backend Log Control Compared
Both parameters are configured the same way and are easy to confuse—they control opposite directions.
frontendHttpLog | backendLogLevel | |
|---|---|---|
| What it logs | What the browser does | What the backend does while serving requests from this browser |
| Mechanism | Records sent over the websocket to the tsm.ui logger | X-Debug-Level header added to outgoing API calls |
| Activation | Parameter and the Diagnostics switch | Parameter only, effective immediately |
| Expiry | 24 hours, per browser | None—clear the parameter when finished |
| Privilege | Toolbar.HttpLog | None |
The two combine: with both set you get the browser's view and the matching server-side detail for the same user action, joined by X-Correlation-Id.
Script Execution Logging
Scripts executed through SpEL bindings automatically generate structured logs with:
- Execution start and completion times
- Script result or failure status
- Correlation context (trace ID, request ID, session context)
- Entity type and lifecycle phase (for entity event scripts)
- Process engine context (if available)
All script logs include the correlation headers, enabling seamless tracing across automation and manual workflows.
Scoped Log Level Control in Scripts
Within SpEL scripts, you can temporarily raise the log level for a specific code block using @logger.withLevel():
@logger.withLevel('DEBUG').do(
    #x = 10,
    #y = 20,
    @logger.debug("Calculation: " + #x + " + " + #y),
    #x + #y
)
How it works:
- The log level is elevated to the specified level (
DEBUG,TRACE, etc.) only for expressions within the.do()block - All logging statements inside the block will respect the elevated level, even if the logger is normally configured at a higher threshold (e.g.,
INFO) - Once the block completes, the log level reverts to its previous state
- The last expression in the block is the return value
Use case: Enable verbose logging for specific sections of complex scripts without affecting the log level globally or for the entire request.
Configuration
Baggage configuration and header propagation rules are defined in the application commons configuration. The specific implementation details (filter names, class structures, configuration file locations) are maintained separately in the infrastructure documentation to avoid coupling business logic with internal infrastructure details.
Refer to the tsm-infra/docs repository for implementation-level details.